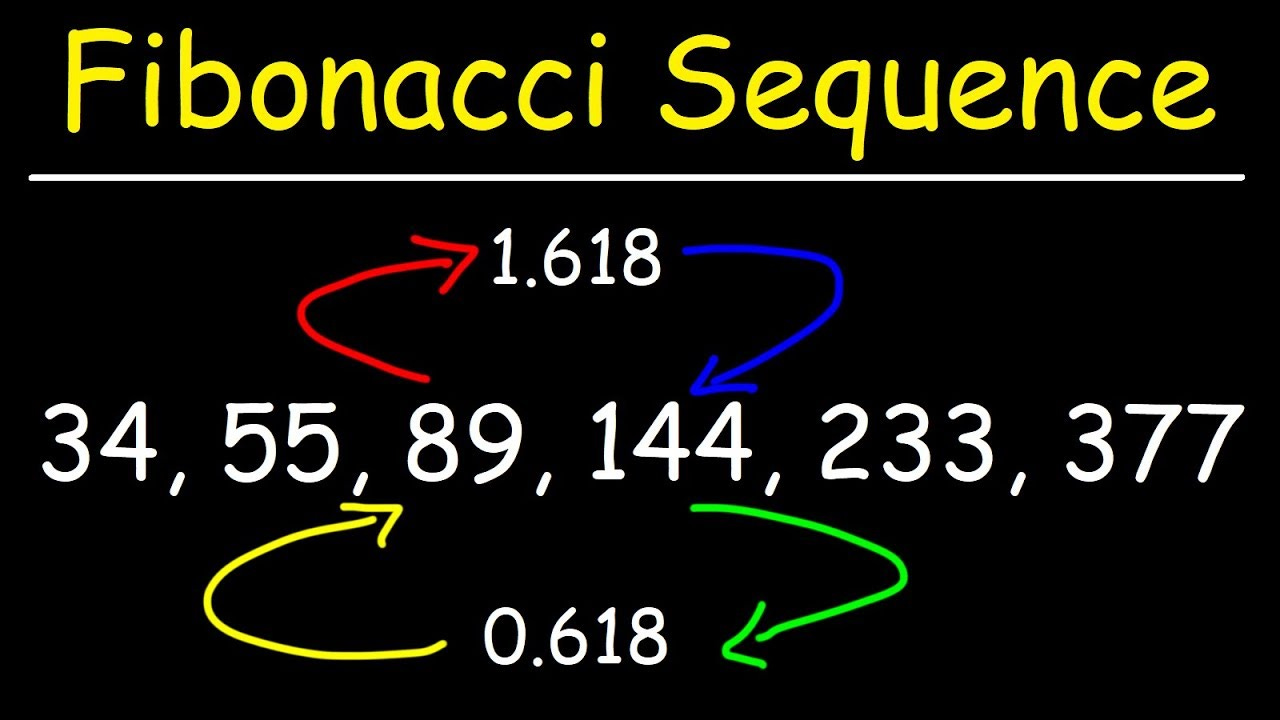
0, 1, 1, 2, 3, 5, 8, 13, 21, 34, 55, 89, 144, 233 ………
What is that strange sequence of numbers, and how is it used to predict Bitcoin’s price movements?
How is this sequence used or found in art, in architecture, in nature, and even in the human body?
I found this whole topic truly fascinating.
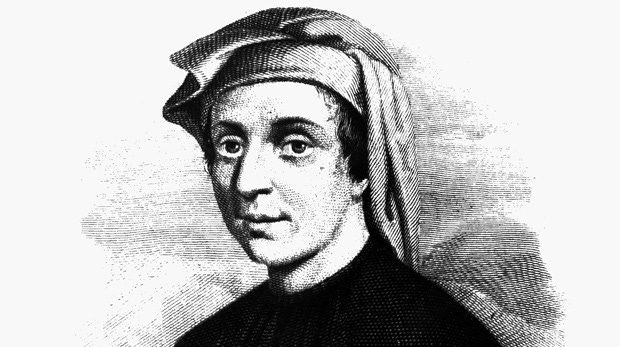
Let’s back up a bit. Leonardo Bonacci, later known as Fibonacci, was an Italian mathematician, considered by many to be the most talented in the Western world in the Middle Ages. Born in 1170 in Pisa, Fibonacci popularized the Hindu-Arabic numeral system in the Western world. But it is his observation and analysis of the “Fibonacci sequence” that he is most remembered for.
In the sequence above, each number is the sum of the previous two numbers.
13 = 5 + 8, 21 = 8 + 13, 34 = 13 + 21, and so on. What’s really fascinating, however, is that the ratio of one number to its previous number is always: 1.618
233/144 = 1.618 89/55 = 1.618 55/34 = 1.618
Conversely, the ratio of one number to the next is: .618
144/233 = .618 55/89 = .618 34/55 = .618
These ratios, together known as “The Golden Ratio,” are found nature, art, and many other places. The Ratio is also used frequently used in technical analysis of stocks and cryptocurrencies.
Fibonacci in Technical Analysis
OK, all this is really cool and you can now dazzle your friends at cocktail parties, or bore them, depending on the party, but how does this all relate to investment analysis?
Well, the Golden Ratio is used to describe predictable patterns in investment prices. The financial markets seem to use the ratio to maintain balance in the markets and to identify situations where assets may be oversold or overbought. Variances from the normal patterns may identify buying, or selling, opportunities.
Simply put, the Golden Ratio can be used to understand investor psychology. I can’t explain this relationship any better than Dima Vonko did, writing in Investopedia. If you take nothing else from this article, please absorb what Vonko is saying:
“In many cases, it is believed that humans subconsciously seek out the Golden Ratio. For example, traders aren’t psychologically comfortable with excessively long trends. Chart analysis has a lot in common with nature, where things that are based on the golden section are beautiful and shapely and things that don’t contain it look ugly and seem suspicious and unnatural. This helps to explain why, when the distance from the golden section becomes excessively long, the feeling of an improperly long trend arises.” - Dima Vonko.
Here are some examples of how Fibonacci analysis is used in predicting Bitcoin price movements and cycles:
After a mid-cycle price runup, Bitcoin usually sees a retracement to the price level of .618 times the high number. The asset finds support at that level, and then the next step of a bull market can unfold.
When Bitcoin’s price hits 1.618 times its 350-day moving average, it meets resistance and usually must pull back a bit before beginning its next leg up.
Fibonacci sequence numbers 13, 8, and 5 have indicated the top of Bitcoin’s market cycles as follows:
350-day moving average X 13 = 2013 market top.
350-day moving average X 8 = 2014 market top.
350-day moving average X 5 = 2018 market top.
If this pattern holds, the next cycle top should occur at the 350 DMA X 3.
Where are we now?
Currently, Bitcoin’s 350 DMA sits at around $47,000. The next upward leg should therefore hit resistance at around $75,000 before pulling back again. But, the cycle top should occur at around $140,000 or the 350 DMA X 3. We’ll see.
Fun Fibonacci Facts:
November 23rd is celebrated as “Fibonacci Day,” because 1 1 2 3 are the first numbers in the sequence, after zero.
The Fibonacci Golden Ratio is a very close factor for converting miles to kilometers and vice-versa.
The Golden Ratio was used in Salvador Dali’s famous painting “The Sacrament of the Last Supper.”
Leonardo da Vinci’s “Mona Lisa” and “Vitruvian Man” are both believed to have been structured with the Golden Ratio, as the ratio is generally seen as being aesthetically pleasing.
There are many examples of the Golden Ratio evident in the human body, in the arms, hands, face, fingers, toes and more.
Issue No. 38, January 7, 2022
Rick Mulvey is a CPA, forensic accountant and crypto consultant. He writes about all things Bitcoin, and yells at the Yankees and Giants. He also runs marathons and makes wine, neither professionally.
Follow on Twitter! The Bitcoin Files Newsletter


